In part one of this post, I covered how to use formulas and conditional formatting to create an auto-updating Gantt chart in Excel. Now, let’s find out how to add different coloured bars to your Gantt chart for each task owner and how to stop tasks starting or finishing on non-work days.
1. Change the formula that powers the Gantt chart
In part one, we used this formula to power our Gantt chart:
=IF(AND(F$2>=$C3,F$2<=$D3),”yes”,”no”)
For an explanation of what this does, see step 5 in the first part of this article. In this step, we want to change that formula so that instead of returning two states — ‘yes’ or ‘no’ — it can return as many different states as there are taskholders.
We have three task owners: the content team, the localisation team, and the client. To display a different coloured bar for each task owner, the cells in the Gantt chart need to be able to check the correct cell in column B — where task owner is specified — and display a value that corresponds to the contents of that cell.
To make that happen, enter this formula into the cell:
=IF(AND(F$2>=$C3,F$2<=$D3),IF($B3=”Client”,”Client”,IF($B3=”Content team”,”Content”,IF($B3=”Localisation team”,”Localisation”,”yes”))),”no”)
This looks complicated, but it just tells Excel to check cell C3. If the value in cell F2 (the date at the top of the column) is equal to or greater than the value in C3 (the task start date) and equal to or less than the value of cell D3 (the task end date), then the cell F3 should display one of these three values:
- “Client”, if that value in cell B3 is “Client”.
- “Content”, if the value in cell B3 is “Content team”.
- “Localisation” if the value in cell B3 is “Localisation team”.
Cell B3 contains the name of the owner of this task. As you can see from the screenshot, the cell into which we’ve entered the above formula now displays the word “Client”.
The next thing to do is, is copy this formula to the whole of week one. Look at the screenshot below, and you’ll see that this gives us our functioning Gantt chart. But it’s a bit hard to read.
2. Update the conditional formatting
This step’s relatively simple. Select the cells in week one of the Gantt chart, then on the ribbon toolbar click the arrow next to Conditional Formatting. From the menu, choose Manage rules.
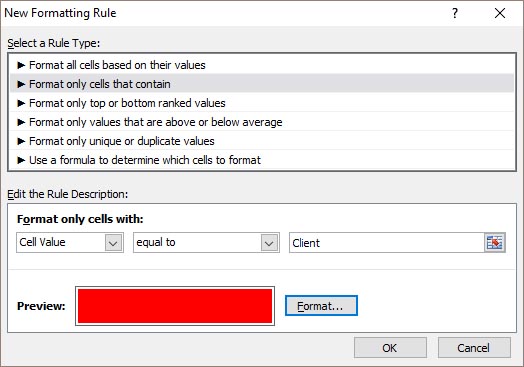
In the box that opens, select New rule. Click on the second item in the list, Format only cells that contain. Under Edit the Rule Description, set up the following rule:
Format only cells with: Cell Value equal to Client
Enter the word “Client” in the box at the end of the condition you’re setting up, as it is in the screenshot below.
Click on the button labelled Format and set the Font and the Fill to the same colour: we chose dark blue with the RGB value of R22, G54 and B92. Repeat the process by adding two new rules, one for the word “Content” and another for “Localisation”, choosing a different colour for each.
When you create your own spreadsheets, you’ll need to add as many conditions as you have task owners. In Excel 2003 you can only create three conditional formatting rules, in more recent versions you can have as many rules as you like.
3. Stop tasks starting or ending on a non-work day
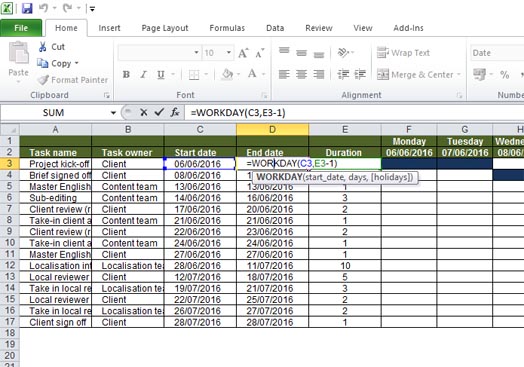
Setting up the Gantt chart to ignore non-workdays is relatively easy. Click in the start-date of task two, in your table of tasks, and replace that formula =D3+1 with this:
=WORKDAY(D3,1)
Instead of starting on the day after task one ends, task two will now start on the workday after task one ends. So if task one ends on a Friday, task two will start on a Monday. Copy this formula to all the cells in your column labelled “Start date”, except the first one which contains the start date for task one.
Now click in the cell containing the end date for task one. In our sample sheet, that’s cell D3. Replace the formula =(C3+E3)-1 with this one:
=WORKDAY(C3,E3-1)
Copy that formula to all the cells in your ‘End date” column.
This tells Excel to calculate the end day of the task by adding only working days to the start date. So if your task starts on a Friday and its duration is two days, instead of having it finish on a Saturday the chart will show it finishing on a Monday.
As in part one of this article, you have to include the “-1” in the article, otherwise Excel calculates the duration as if it doesn’t include the start date. The Gantt chart would, for instance, show a one-day task as lasting two days.
4. Create a list of non-standard holidays
So far, so good. But what about all the non-standard holidays your team and your client take? Or what if you work in a country in which the weekend doesn’t fall on Saturday and Sunday?
The workday formula allows for this. Create a second worksheet in your Excel workbook. In ours it’s called “Holidays”.
Select the first column in this spreadsheet, right click and from the context menu choose Format Cells. From the list on the Number tab, choose one of the date formats. This tells Excel that the values you enter in to this column are dates. Click OK to exit the dialogue.
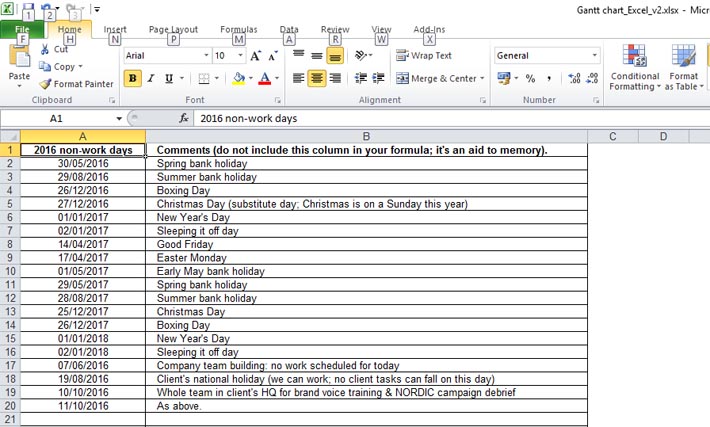
Now enter all the dates for all custom non-work days, days you don’t want included in a task’s duration, into this column. Your national holidays, your annual leave, your company’s team-building days — enter the dates of all of them in this column.
It’s probably a good idea to format the selection of cells you plan to dates into: the first hundred or so cells in the column should do. This lets the user know if they’re going outside the active area: you don’t want them entering dates anywhere and then wondering why the Gantt chart can’t see those dates.
5. Now make your Gantt chart aware of those non-standard holidays
Back on the worksheet containing your Gantt chart, click in the cell containing the end date of task one. It contains the formula:
=WORKDAY(C3,E3-1)
But the workday function allows us to specify holidays, in the following format:
=WORKDAY(start_date,number_of_days,holidays)
All we need to do to make our Gantt chart not schedule tasks on custom non-workdays, is to point our workday formulas at the column of holiday dates we just created.
In the ‘end date’ cell for task one (cell D3 in our sample worksheet), click into your formula and move the cursor so that it sits right before the closing bracket and type a single comma.
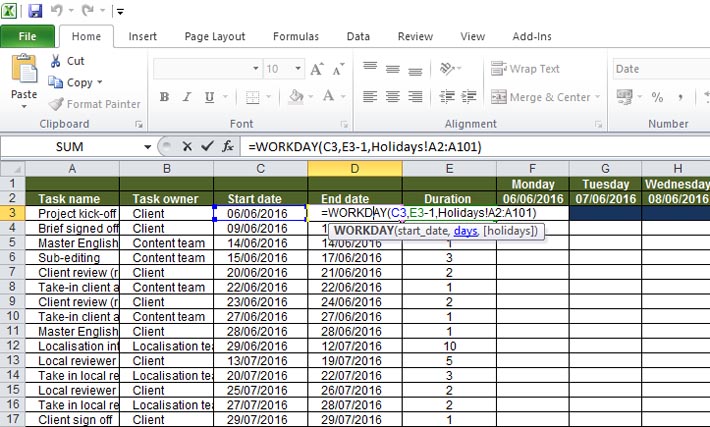
Now click on the Holidays tab, click in the first cell in your column of dates and drag to select the entire formatted area of the column. Press enter, which will return you to the worksheet which contains your Gantt chart. Your formula will now look like this.
=WORKDAY(C3,E3-1,Holidays!$A$2:$A$101)
Make sure you add the dollar signs in front of the column and row values to stop the cell values in your formula changing as the formula is copied into other cells.
Select the cell you’ve just updated and drag down to copy your new formula to all the remaining cells in your “End date” column.
Now, in the same way, add your list of holidays to the formulas in your “Start dates” column. Remember, don’t update the cell in which you enter the start date of your project. You always need to enter that manually.
6. Protect your work
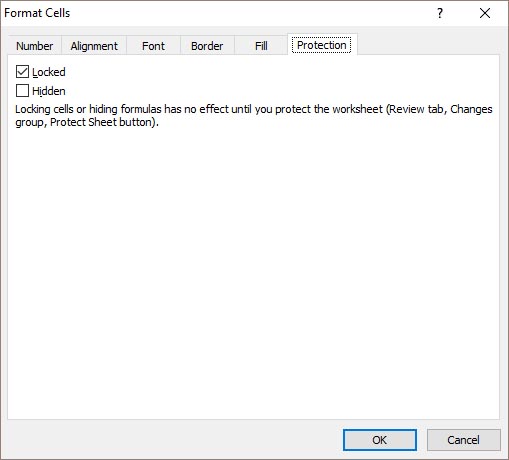
At least one of the people you send this to will flail at the keyboard with their fists, trying to colour in the cells manually. In the process, they’ll break the sheet.
This is bad. Not only are they wasting your time and making your life more complicated, there’s also the cost of the hitman and, you know, trying to dispose of their body, and all the complications that go with that. So let’s avoid that, by protecting the sheet.
Click on the very top cell in the grey sidebar, between the number 1 and the letter A. This will select all the cells in the worksheet. Right click one of the select cells and choose Format Cells. On the Protection tab, make sure that the box labelled Locked is ticked and then click OK.
Left click anywhere on the sheet to deselect all the sheet’s cell. Now, we have to unlock the cells you want the user to be able to edit. These are:
- All the cells in the first column; the one labelled Task name.
- The cell in your table of tasks that contains task one’s start date (C3 in our sample worksheet).
- All the cells in the Task duration column (column E, in our sample).
Select these cells, all together or one at a time. Right click, choose Format Cells from the context menu, and on the Protection tab this time make sure the box labelled Locked is unticked.
Finally, on the ribbon tab named Review, above the words Protect Sheet you’ll see a grid icon with a padlock superimposed upon it. Click on this icon, then click on OK in the box that pops up.
And that’s it. Your worksheet is protected.
And that’s all folks…
That’s pretty much it. You have an Excel sheet containing a Gantt chart that auto-updates whenever you change either the start date or the duration of a task: no need to manually colour in blocks of cells in Excel, every time a deadline changes.

